

After the 2020 election, I wrote an article for respected columnist Perry Bacon entitled, “How Kentucky’s State House Got So Red And Why Democrats Are Positioned To Reverse Some of the GOP Gains Next Year.” You can find it on his blog here. I promised to revisit this analysis after the 2022 elections.
Unfortunately for Democrats, the 2020 GOP gains were not reversed, though there were a few bright spots. Republicans remain dominant in state politics, upping their supermajority from 75 State House seats in 2020 to 80 in 2022. They also super-dominate the State Senate and control all but 1 of the 6 elected statewide offices.
Quick recap
If you’re reading this, you likely know that Kentucky was not always so red. Democrats controlled the State House for 95 years, but Republicans finally gained control in the 2016 election cycle, climbing from 47 seats to 64 seats. Democrats netted 1 seat in the 2018 midterm, perhaps in part due to the “teacher wave” in response to Bevin policies, but Republicans netted 13 more seats in 2020 as part of the Trump wave (note: some were special elections) and 5 more in 2022, for a total of 80 out of 100.
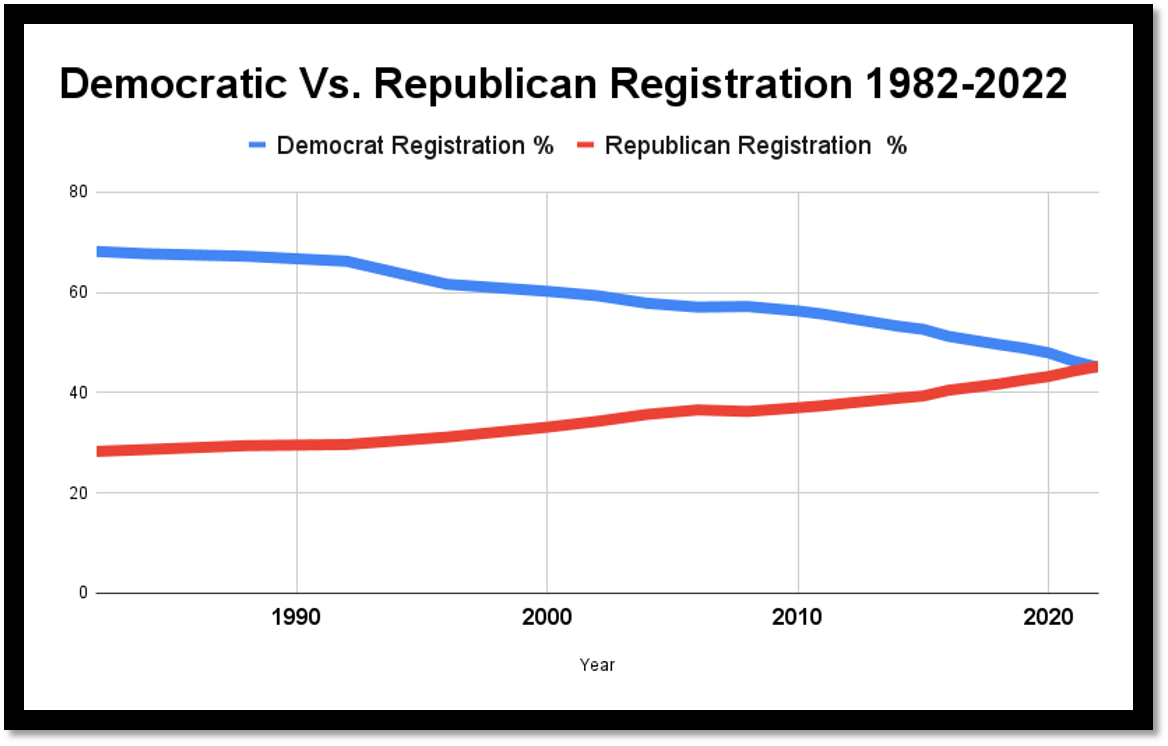
Voter registration in Kentucky has consistently shifted away from Democrats over the last 40 years (see below) and in June of 2022, Republicans eclipsed Democrats for the first time in modern history.
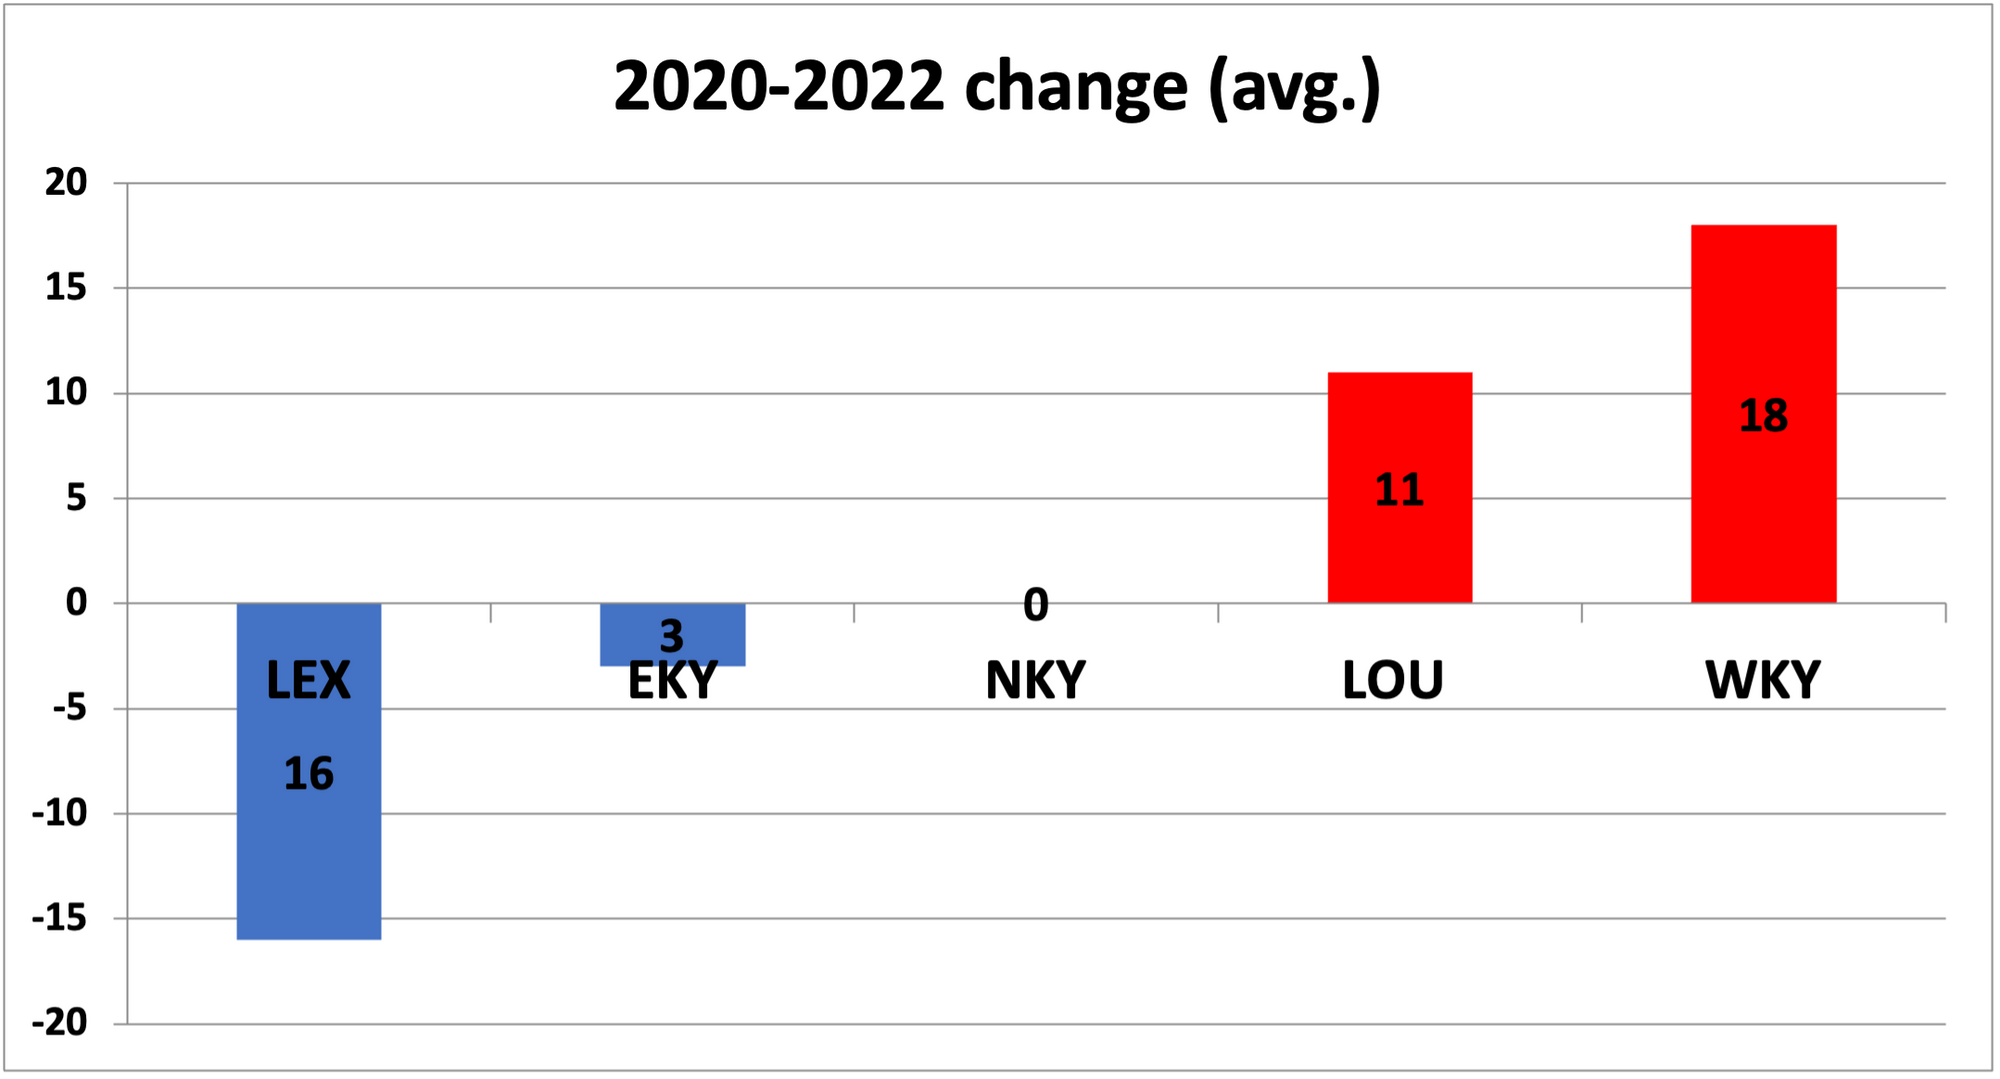
For the 2020 paper, I compared 2016 to 2020 Kentucky state House results by dividing Kentucky into 8 regions: Western Kentucky (WKY), Central Kentucky (CKY), Louisville-greater (LOU-G), Lexington-greater (LEX-G), Northern Kentucky (NKY), Eastern Kentucky (EKY), plus 2 subsets of the urban centers, Louisville (LOU), Lexington (LEX). The margins represent how much more Republican or Democratic each area became (on average) from 2016 to 2022.
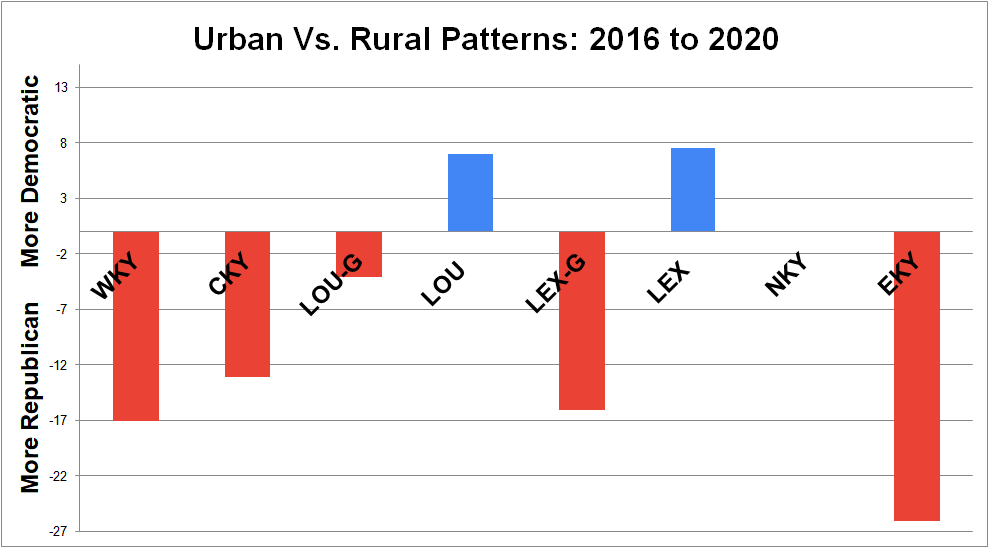
We noted that Republicans did better in rural areas while Democrats performed well in urban areas.
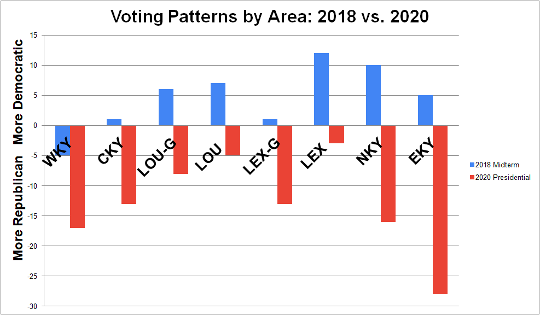
We also compared midterm election years to presidential election years. Republicans were strongly favored in recent presidential election years (especially in rural areas) compared to democrats who did better in recent in non-presidential election years (especially in urban areas).
In the last paper, I asked, “The 2018 midterm saw gains for Democrats, and because Trump won’t be on the ballot, could the next midterm [2022] be more like 2018?”
Based upon recent data, Democrats put up stronger performances in midterm elections, but there’s something that was very difficult to accurately predict – the degree to which redistricting & gerrymandering would impact state House districts. In many cases, these challenges put a heavy anchor on Democratic success, and perhaps dissuaded them from running.
First, take a look at how many seats went uncontested in 2022 compared to previous years:
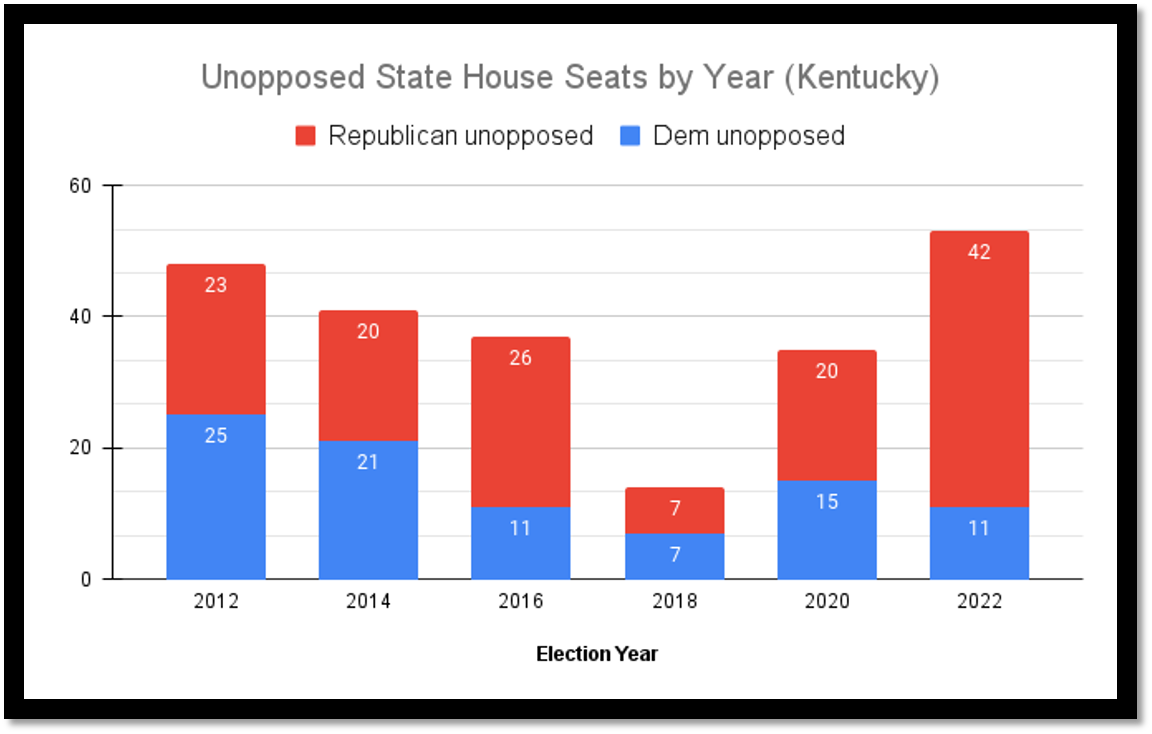
Why so many unopposed seats? Was it the unknowns of redistricting? A feeling of inexorable defeat given the voter registration trends over time, COVID, a lazy midterm, complacency, or something else?
What about specific districts where Republicans or Democrats did well? Below is a chart of all the contested races noting the percent change in the margin of victory/defeat from 2020 to 2022 (note: uncontested races are not included). Blue lines represent an increase in democratic strength 2020 vs. 2022, and red lines represent republican strength 2020 vs. 2022.
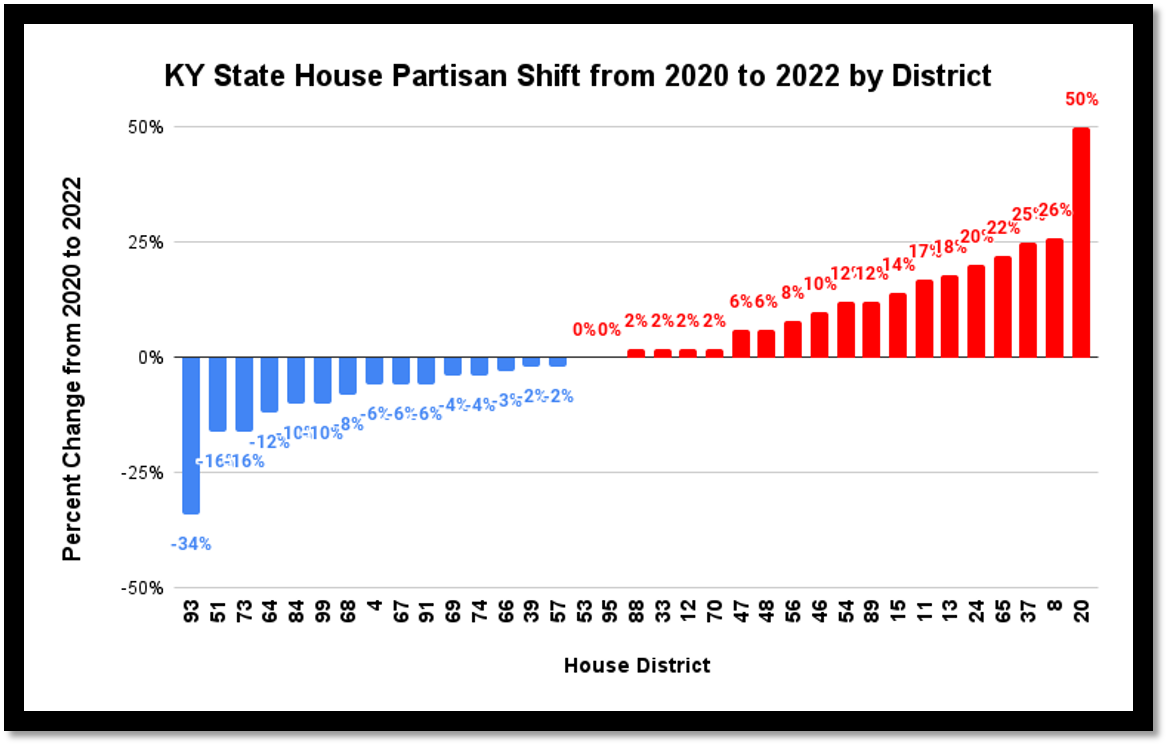
Some notable results that benefited Democrats (from left to right)
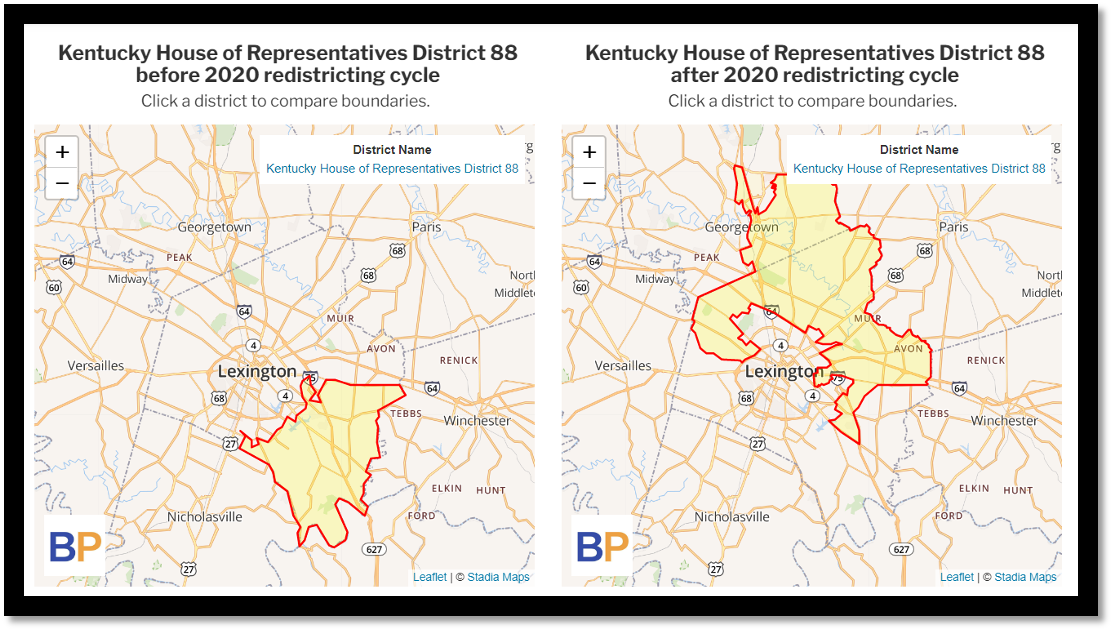
- HD 93 (longest blue line): Democrats are happy that Lamin Swan (D) flipped a Republican seat to Democrat. But redistricting played a part in this. HD 93 was Republican Nina McCormik’s seat in southeastern Kentucky; now it’s part of Lexington/Fayette. See maps here.
- HD 51 (2nd longest blue line): The previous map included Columbia and Campbellsville and the new map includes only Campbellsville and Lebanon (without Columbia).
- HD 73 (2nd longest blue line tied): Though this seat is held by Republican Ryan Dotson, HD 73 now includes some of Fayette County in addition to Winchester.
- HD 64 (next longest blue line): Held by Kimberly Moser (R), this seat became bluer due to the expansion of the district to include southern areas of Covington.
Districts with little change (<1%)
- HD 53: Republican James Tipton’s seat had a net change of 0% from 2020-2022. Note that the pre- and post-2020 map is almost identical.
- HD 95: Democrat Ashley Tackett Laferty’s margin was unchanged. Her district was also mostly unchanged relative to redistricting.
Notable race
- HD 88: Though this district changed significantly due to redistricting, incumbent Rep. Cherlynn Stevenson still won by 35 votes (0%).
On the Republican side
- HD 20: Democratic Rep. Patti Minter’s seat changed by a whopping D+40 to R+10, in large part due to redistricting (It’s worth noting that Minter ran against an Independent in 2020 who did not perform well. The Dem win percentage in 2012-2018 ranged from 6-28%. There were no Republican wins in that period).
- HD 8: This district that was once strongly Democratic (D+ 38 in 2012) is now a Republican + 35 due to trends and redistricting. The new maps include a huge rural area outside of Hopkinsville.
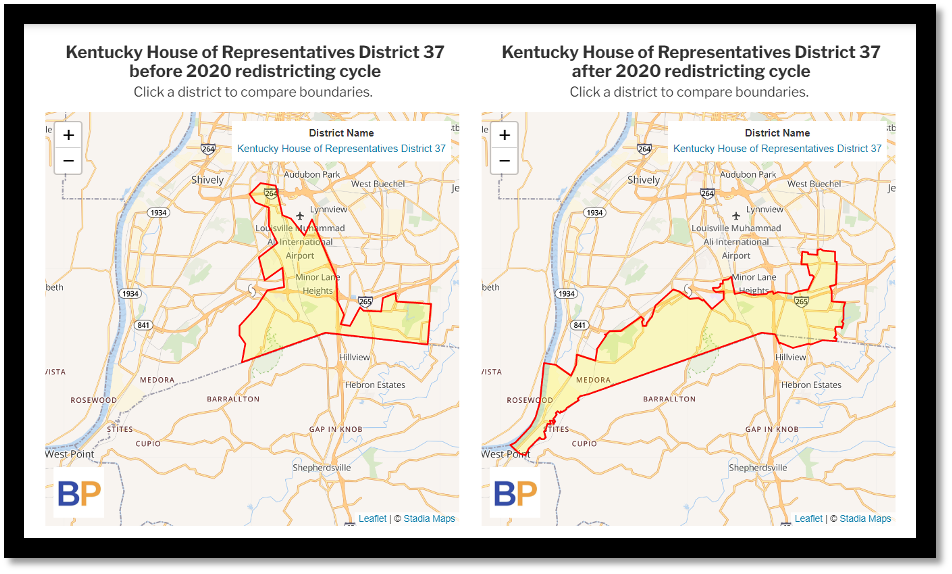
- HD 37: In a major loss for Democrats, long-time Louisville Rep., Jeffery Donahue, lost this seat to Republican, Emily Callaway. Notice how the district is moved from urban/suburbs to the more rural areas of south Louisville.
- Other Democratic loses due at least partially to redistricting include House Districts: 28 (Miller), 31 (formerly Raymond), 65 (Wheatley), and 94 (Hatton).
A bright spot for Democrats?
Even with redistricting, and even though Democrats had a net loss of 5 seats in the state House, the cumulative statewide average percent by which Democrats lost in 2022 was less than 2022 by 5% (-27 in 2020 to -22 in 2022 = 5%).
Below is the average of all contested state House seats from 2012 to 2022. Positive numbers are Democratic advantage and red are Republican advantage:
This could be due to a number of factors: the fact that it’s a midterm year and a presidential candidate (Trump in the case of 2020) is not on the ballot, national Democrats outperforming predictions, the abortion amendment, the US Senate at the top of the ticket, or just the natural flow of things.
Will this trend continue?
Revisiting the previous question about urban vs. rural, do we see any evidence to support this trend continuing (adding in the variable of redistricting)? Below is the new 2022 map:
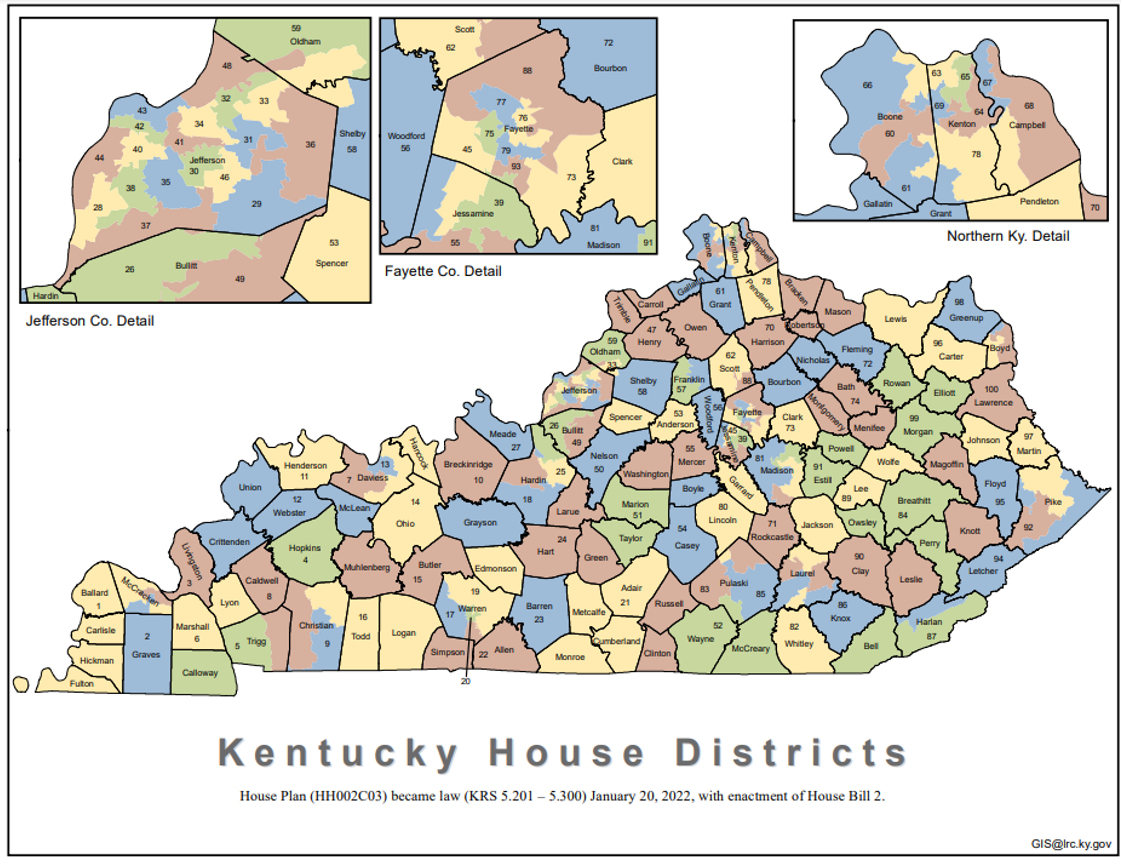
First, there are a number of exceptions, but very generally speaking, the State House District numbers represent the geographic areas below:
- 1-15 - Far Western Kentucky (ex: Fulton, Calloway, Trigg, Christian, Muhlenberg)
- 15-30 – Western & central Kentucky (ex: Warren, Allen, Barren, Hart, Meade)
- 30s - Mostly Jefferson County
- 40s – Some Jefferson County (with a few others in seemingly random areas)
- 50s – Central Kentucky other than Fayette (Franklin, Anderson, Washington, etc.)
- 60s – Far Northern Kentucky (ex: Boone, Kenton, Campbell, Grant)
- 70s – Other Northern Kentucky areas, with a few in seemingly random areas
- 80-100 – Eastern Kentucky (ex: Bell, Pike, Laurel, Estill, Lee, Wolfe, Morgan, etc.)
So, in which geographic areas did Democrats’ margins increase this election cycle? (Note – these are percent change from 2020 election by district, not vote totals). HD 93’s margin increased most, followed by HD 51, 73, 64, 84, and so on. But it’s important to note that HD93 was transplanted, so an “apple-to-apple” comparison is not relevant.
Which geographic areas benefited Republicans? Ranked from least to most:
Which areas were neutral?
If we apply the same parameters we did in 2020 to 2022, below are the average advantages for each geographic area (that had contested races). Of course this is a generalization because some individual races were redistricted/gerrymandered more so than others (for example, if we were to remove the NKY HD 65 upset (Wheatley/Dietz), NKY would go from 0 to a 6 percent Democratic advantage). The blue indicates Democrat advantage while red indicates Republican advantage.
In conclusion
To revisit the original question, I’ll say what I said before - I know better than to try and predict the future of Kentucky politics. It does appear that Kentucky continues to trend red when you look at voter registration by year (and even month). I have been curious for a while now if this will “bottom out” any time soon.
Will 2024 be another good year for House Republicans or will Democrats be able to retake some seats? See the table below for the 2022 closest state House races and how those seats have changed over time. I suspect Democrats will pay special attention to any loss on this table. Expect Republicans to eye the seats on the bottom of this list.
The colors in the 2012-2022 columns represent party control during that time.
Given that have now had our first post-redistricting election, I hope this article provides a baseline for what to expect going forward.
Special thanks to Rebecca Blankenship for reviewing this article!
--30--

This analysis was written by Dr. Trent Garrison (Ph.D. in Geology). Dr. Garrison is a past president of the Kentucky Academy of Science, and is an assistant professor at KCTCS.